Table of Contents
When considering my options for the final project I quickly focused in on improving a project from a previous visualization class. Since I work as a system administrator, I thought building systems visualization tool would be a good use of my time. Although I originally wanted to cover a broad range of system statistics (file system, memory, network traffic, running processes, etc.), I focused specifically on file systems and their attributes. File systems can contain thousands to millions of files arranged in hierarchies that are often dozens of levels deep. Doing any analysis of a file system as a whole is difficult because of the sheer number and distribution of files involved. Any text based summary is going to be difficult to process and will quickly overwhelm a user.
I am often looking for ways to free up disk space on servers when free disk space is low, so my first motivation was to quickly identify large files and directories that might be good candidates for pruning. With some of the additional color schemes I implemented, I can get further insights into a file system at just a glance
At its root (pun intended), this is not a novel idea. There are several treemap alogrithms and codes available and numerous treemap visualizations available. I was originally turned on to treemaps by the Wall Street Journal's map of the market. I also had played with the treemaps at IBM's Many Eyes visualization tool. There are also existing file system visualizers that use treemaps (http://www.marzocca.net/linux/baobab/, http://windirstat.info/, etc.)
In all my searching, I did not find any such tools that were available for MacOS, nor did I see any that had the 3D or the other features I wanted to implement.
I built this application on a Mac, but it was built with frameworks/libraries that should work on Linux without too much hassle. I guess Windows could be an option as well, so long as you could get "ls" style file listings.
Technologies Used
- C++
- FLTK
- OpenGL
- SVL
Key goals in reviving this project
- Implement a stereo view for use at the Viswall
- Implement picking, so a user could click on a file, instead of having to scroll through a list
- Improve performance to make it interactive with larger file systems
- Hook up a UI to make it more intuitive to use. Labeled buttons are much easier than keyboard soup...
I experimented with a few tools for getting the file system data into my data structure. I wanted to hook into kernel-level facilities to be able to show live data. It would have been valuable to see the consequences of actions you took in the file system (deleting files, moving directories, etc.), but that was outside the scope of this course. I ended up using the very non-sophisticated "ls -alRT", which recursively lists all files and directories below the path specified.
uitatechia02:~ ialtgi01$ ls -alRT .DepthTest
total 424
drwxr-xr-x 5 ialtgi01 staff 170 May 4 18:06:02 2009 .
drwxr-xr-x+ 43 ialtgi01 staff 1462 May 9 08:55:41 2009 ..
-rw-r--r--@ 1 ialtgi01 staff 6148 May 4 18:06:26 2009 .DS_Store
drwx------ 5 ialtgi01 staff 170 May 4 18:06:21 2009 DepthTest
-rw-r--r--@ 1 ialtgi01 staff 208693 Sep 20 09:34:00 2002 Picture 8.png
.DepthTest/DepthTest:
total 424
drwx------ 5 ialtgi01 staff 170 May 4 18:06:21 2009 .
drwxr-xr-x 5 ialtgi01 staff 170 May 4 18:06:02 2009 ..
-rw-r--r--@ 1 ialtgi01 staff 6148 May 4 18:06:26 2009 .DS_Store
drwx------ 5 ialtgi01 staff 170 May 4 18:06:26 2009 DepthTest
-rwx------@ 1 ialtgi01 staff 208693 Sep 20 09:34:00 1994 Picture 8.png
I wrote a parser to ingest and digest the data and store the relevant information into a custom data structure (class: fileSystemObject). Once the data is loaded, then it is drawn onto the screen using a treemap code I wrote. The colors of each file are determined by the attributes of the file, depending on the coloring mode enabled.
- Random – this mode colors the files randomly. This method is quite useful for seeing all the files, since the other methods often color neighboring files the similar colors, since they often have similar attributes.
- Depth – this mode colors each file a shade of gray that corresponds to the files depth in the file hierarchy. The deeper the file is, the lighter its color.
- Size – this mode colors each file a shade of purple, based on what percentage of the parent’s total size that file contributes.
- Permissions – this mode colors each file according to the file permissions assigned to the file. Each channel corresponds to a different part of the permissions:
- Red – user permissions (.33333 each for read, write, execute)
- Green – group permissions (.33333 each for read, write, execute)
- Blue – other permissions (.33333 each for read, write, execute)
- Time – this mode colors files a different shade of green based on the file’s modification date. The newer the file, the darker the shade.
I accomplished most of what I set out to do, but didn't get to focus as much on performance as I'd like. Picking turned out to be a little more complicated than I anticipated. The complication came in retrofitting the drawing code to be allow for switching rendering modes and keeping track of the "names" of drawn primitives. The basic concept of "picking" isn't too complicated:
Picking Steps
- modify drawing code to initialize the OpenGL Name stack
- set the name stack appropriately in drawing code
- draw scene in GL_RENDER mode
- handle mouse click
- redraw scene in GL_SELECT mode, with a view frustum that only includes the pixel under the mouse pointer
- process the list of names that are written to the selection buffer
The next feature I was excited to work on was a 3D/Stereo display, because we had just installed a Mac Pro at the Viswall and I had been hoping to take advantage of the facility. Displaying stereo at the Viswall is a fairly straightforward process:
Drawing Stereo
- split the horizontally window into two viewports
- in the right viewport draw the scene with a "from" parameters of gluLookAt() shifted to the right
- in the left viewport draw the scene with a "from" parameters of gluLookAt() shifted to the left
- size window such that it spans both projectors, with the left viewport fully covering the left-eye projector and the right viewport fully covering the right-eye projector
I did some code refactoring to improve performance, but there are several fundamental performance problems that would take serious work to address. I have a handful of performance improvements outlined in the Future Directions section.

Random Color Mode
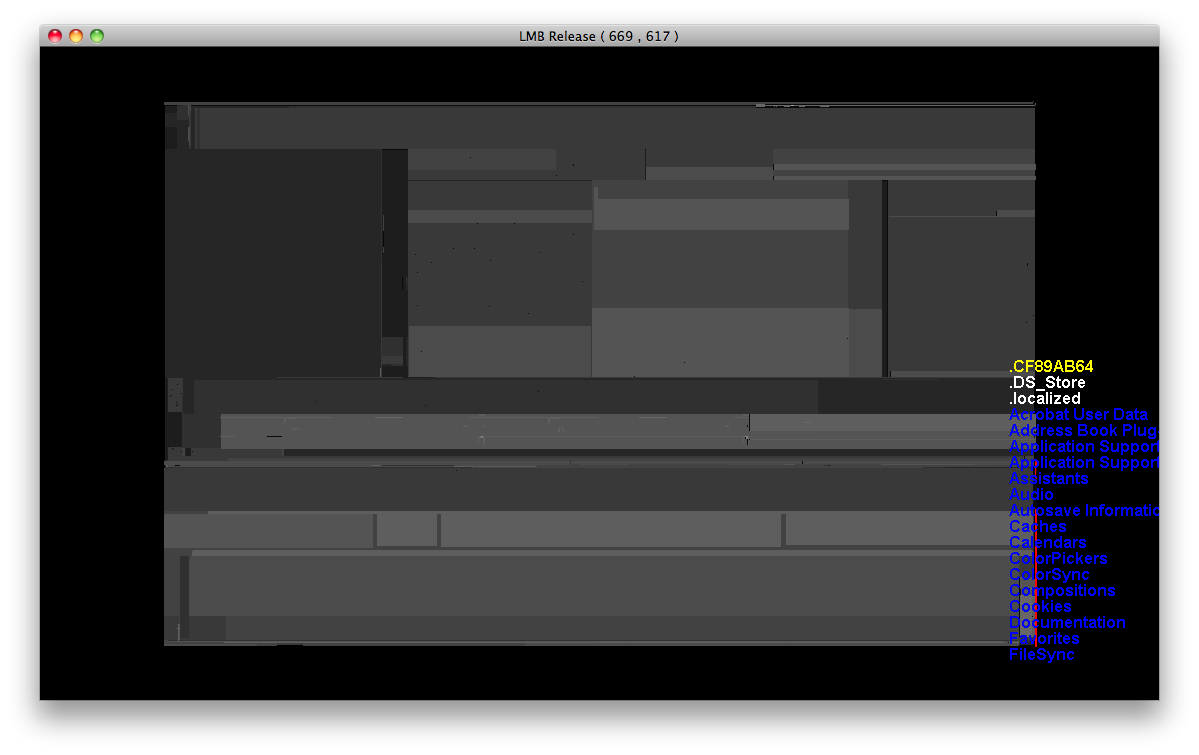
Depth Color Mode
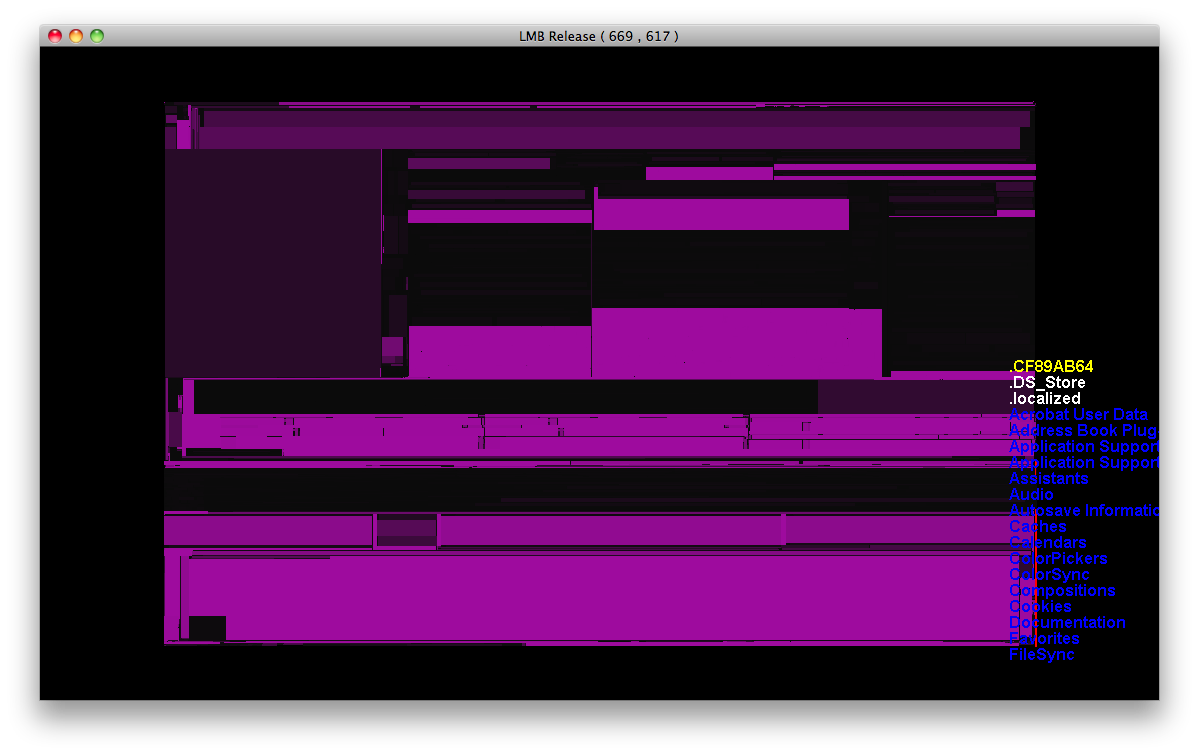
Size Color Mode
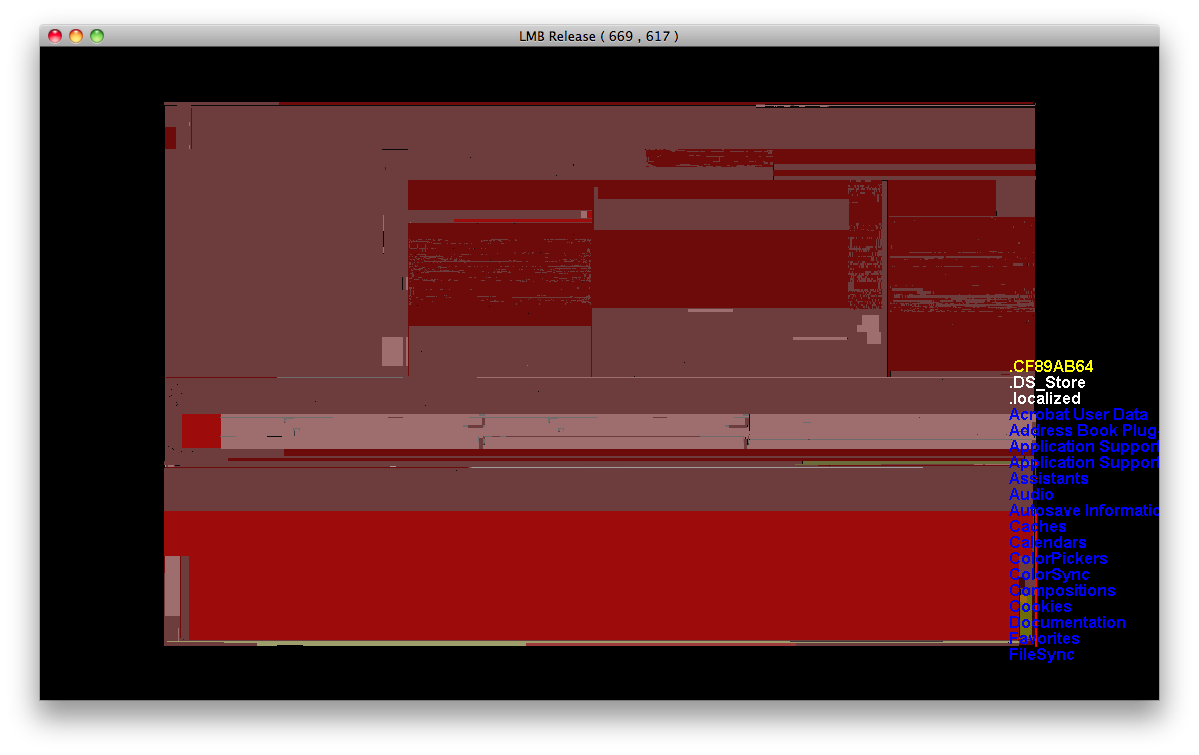
Permissions Color Mode

Time Color Mode

Stereo Mode

"Traditional" tree view
CS175Project
Any project that has a due date is bound to be "incomplete." Below are a handful of features/fixes I wish I had time to implement:
-
Refactor drawing code. Currently all of the calculations for the subdivisions are done with every frame. This code is very explicit and creates a lot of intermediate data structures. This information could be calculated once and stored in the data structure. This would only increase memory usage by a few percent but would decrease CPU usage significantly.
-
Add/refine controls. My current mouse controls are clunky and keyboard controls are unorganized and unintuitive. I lost focus on the mouse controls once I abandoned the 3D tree view.
-
Add a legend for each color mode. Currently there is no way for a user to know to what the colors correspond without reading and interpreting the source code.
-
Extend the coloring modes to the 3D tree view. This shouldn’t be much additional work and it would greatly improve the limited value of the current 3D tree view.
-
Make the tool cross platform (at least Linux compatible). Very little of what I have done is Mac OS X specific. I did not have time to sort out some linking issues that kept me from running the software on Linux machines, in particular the Viswall workstation.
-
Add alternate drawing methods. A radial graph version could emulate a physical hard disk.
-
Generalize and expand data source. Currently the tool calls a system command (ls -alRT) to get the file system info. I would like to define an input format so this input could be saved in a file. This approach could be used on any system, so long as a secondary tool existed to create the input file from the file system.
-
Bring the tool to the Viswall Linux workstation. With the display I am working if I view my entire file system, each pixel represents 200KB. On the Viswall, each pixel would represent ~10KB.
There are numerous other potential improvements I see every time I use the tool, but these are the ones of which I am consistently reminded.
Resources